Atlantic '41
Building the Engagement Loop (Part one)
The story so far: both the periscope and bridge views work, with ships to be implemented. Encounters will be resolved as a succession of turns, the player assessing the situation and taking action with the help of three distinct screens: the outside view (either bridge or periscope), if available, the tactical chart, and the torpedo data computer.
We’re still missing both the tactical chart and the TDC. In this log I’ll cover the tactical chart, after a brief conclusion on ships’ implementation.
Maths...
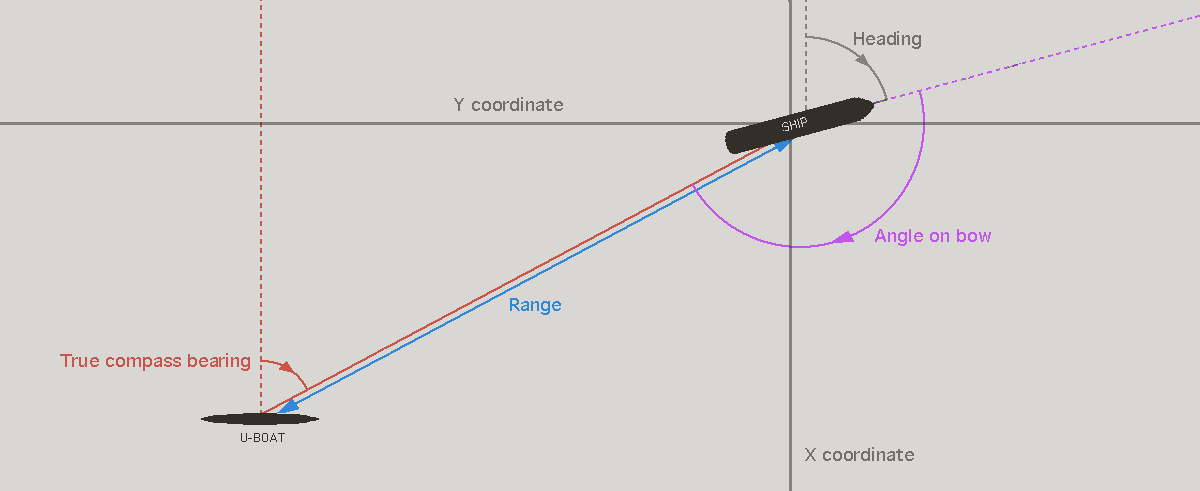
Since I dropped out from college to pursue my videogame developer career, I never missed math. Yet after 30 years, I finally found a use for trigonometry: calculating distances and angles for Atlantic ‘41. For now I manually fill convoy tables with position, heading and speed for every ship.

A test convoy and the data calculated
Eventually a system will randomly generate convoys with ships from a pool based on their availability and frequency at a certain date and in a specific sector, or pre-scripted convoys recreating historical events. Then it will assign individual ships’ positions, headings and speeds, following the logical structure of a convoy; generally cargo ships and tankers in the center of the convoy, flanked by military escorts.
Then the program, for every ship, calculates what’s needed for the action to take place, like their distance to the U-boat, true compass bearing, angle on bow, and loads up the appropriate pre cached image for the exterior view. Every turn, data and images are updated to reflect the changes.
In grey, the randomly generated data. In color, the resulting computed values.
It’s advantageous for performance, since the math happens once in between turns rather than every frame. And it’s economical for memory, storing a single image per ship, rather than all the pre cached variants. Lua is slow when it comes to math and trigonometric functions, so it’s a relief not to have to carry that stuff every frame.
It all worked as expected, if not for the ships looking pasted onto the background rather than part of the scene. Adding an animated waterline would fix that, except that there’s dozens of different ship bitmaps of various lengths. Thankfully the SDK offers a neat clipping function, so I created an animated waterline covering the whole screen and trimmed it at run time.

Animated waterline
Torpedo Attack 101
First I must stress that the following description of U-boat strategy is an oversimplification that would make any naval college historian weep. In reality, convoys had much more complex structures involving dozens of ships with very specific tasks. U-boat attacked in numbers, as part of wolfpacks, and the situations were more layered and complex. I’m an amateur game developer, not a naval strategy expert. And Atlantic ‘41 being a game on a small portable console, I must take shortcuts. However I want to try and make sure that the gameplay doesn’t betray the essence of the topic.
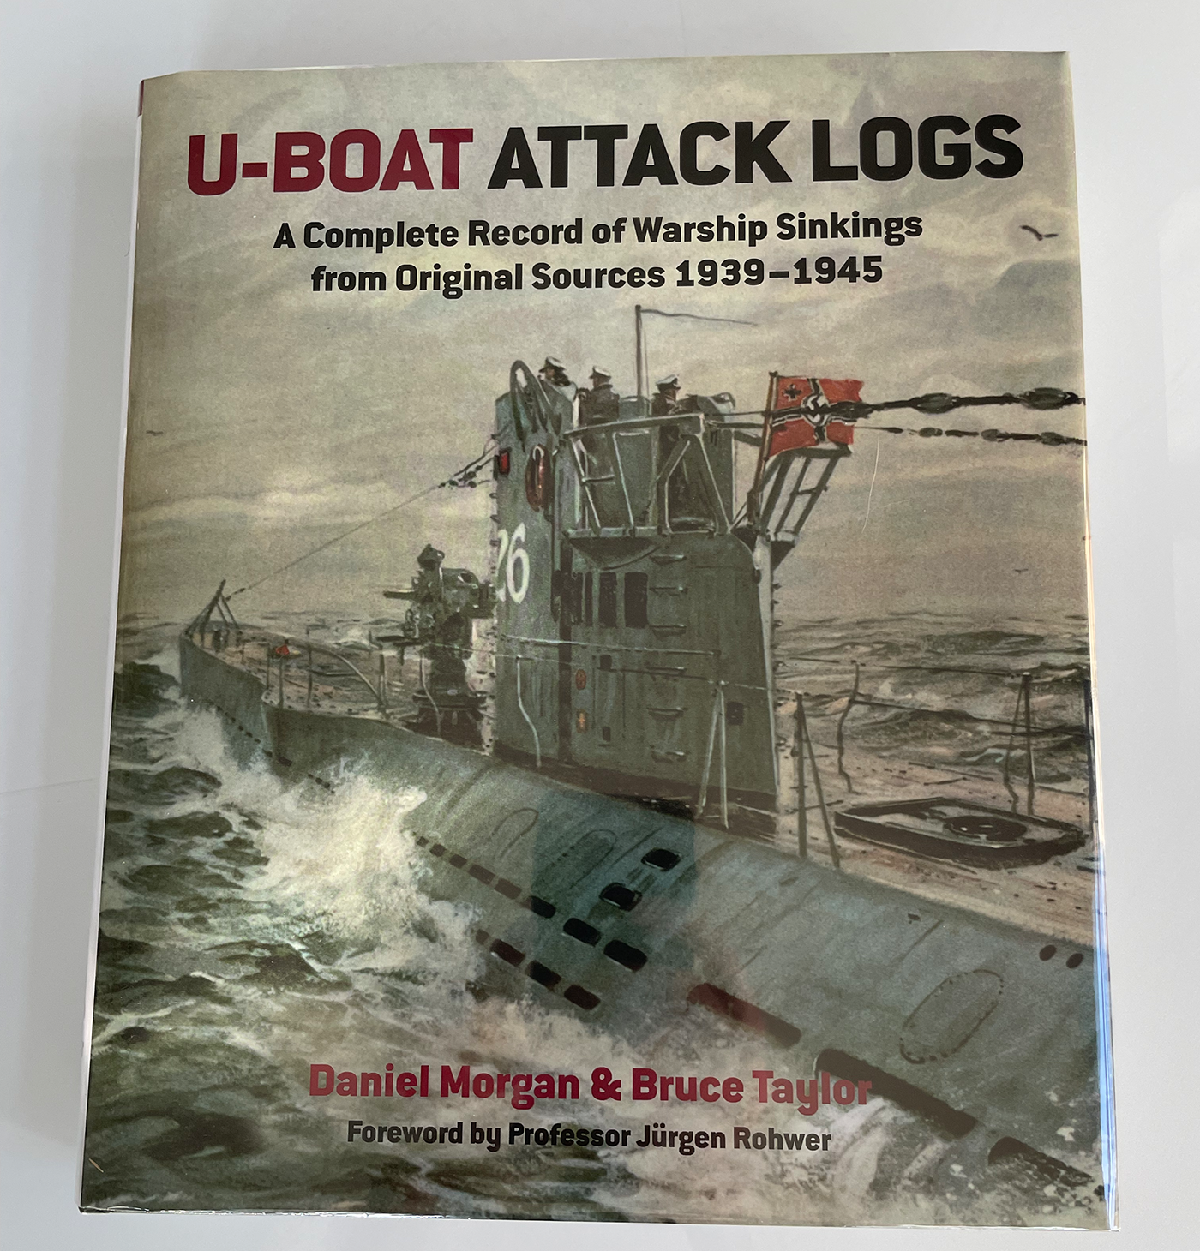
Direct from the source
With that aside, it’s safe to say that U-boat warfare was tactical in nature. It was a game of deception and patience, in which the U-boat’s objective was to maneuver into the best position for a successful torpedo attack while avoiding detection. An overview of a typical U-boat engagement should illustrate why I think that the gameplay needs three distinct screens.
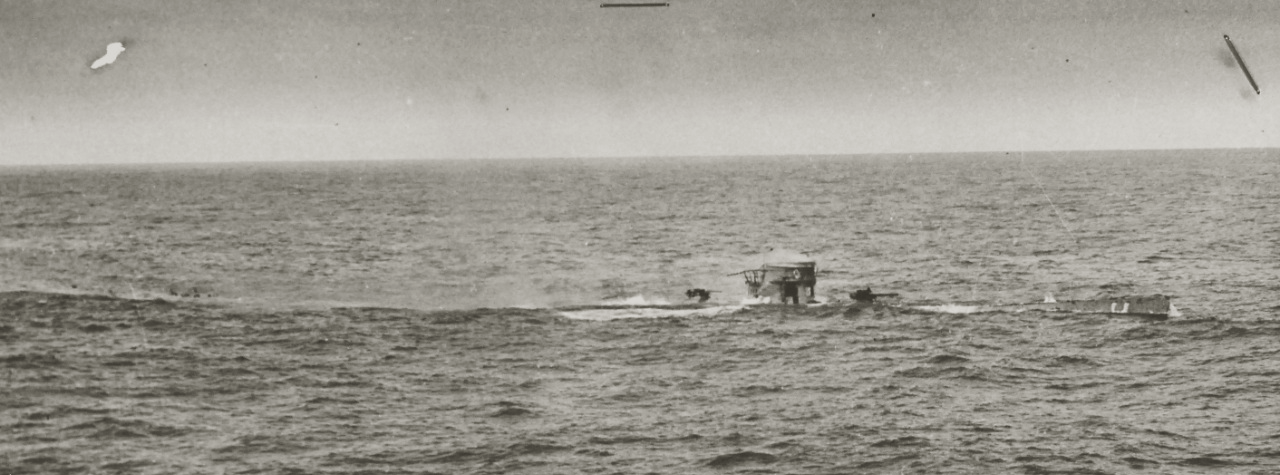
Even surfaced, a U-boat low profile is hard to spot
Historical U-boat attack logs demonstrate that most encounters follow a common structure. The U-boat spots a convoy, either by chance or as a result of cabled intelligence. Then a chase ensues, which can last several hours, during which the U-boat ghosts the convoy at a safe distance. It’s surfaced to harness the power of its diesel engines. The captain observes the convoy from afar, assessing possible targets and threat.
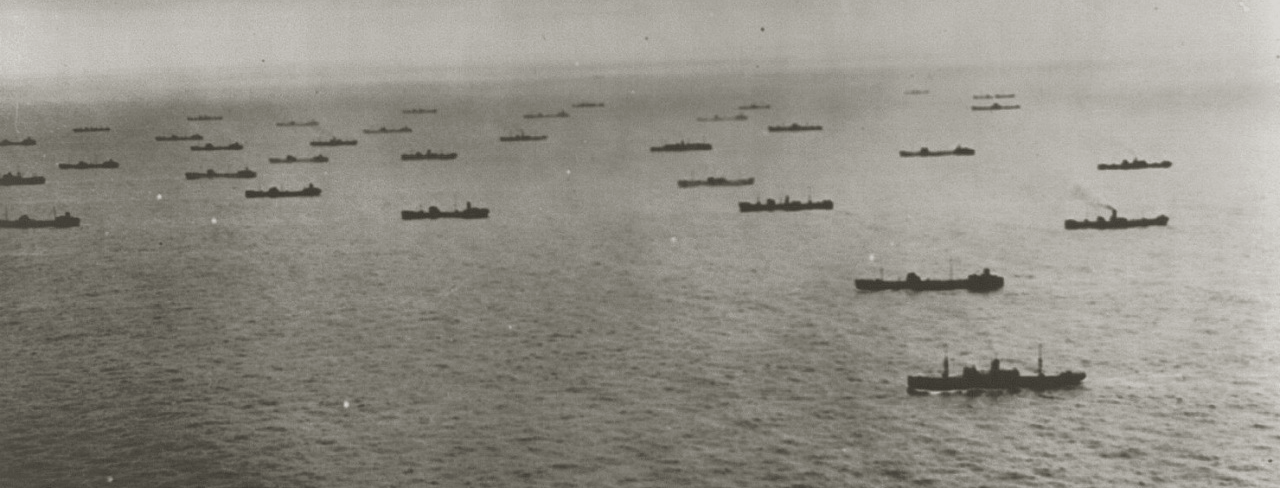
Convoys can extend to the horizon
The U-boat then creeps into an optimal position to attack the most valuable or vulnerable targets. During this phase, two notions are paramount: the boat must remain hidden, and should always have a quick way to escape in case it’s discovered. Reckless or inexperienced captains have sometimes boxed themselves inside a convoy, with no clear path to open ocean. This situation could lead to disaster.
If this approach is successful, the U-boat can now conduct the attack. Often, the captain will order a series of torpedos launches in rapid succession, sometimes on several targets. The attack has to be as quick and brutal as possible, because there might not be a chance at a subsequent torpedo run; it’s the hope of the captain to cripple one or more targets to prevent their escape. But more importantly, in case of a hit, the encounter moves into its third phase, the most hazardous for the submarine.
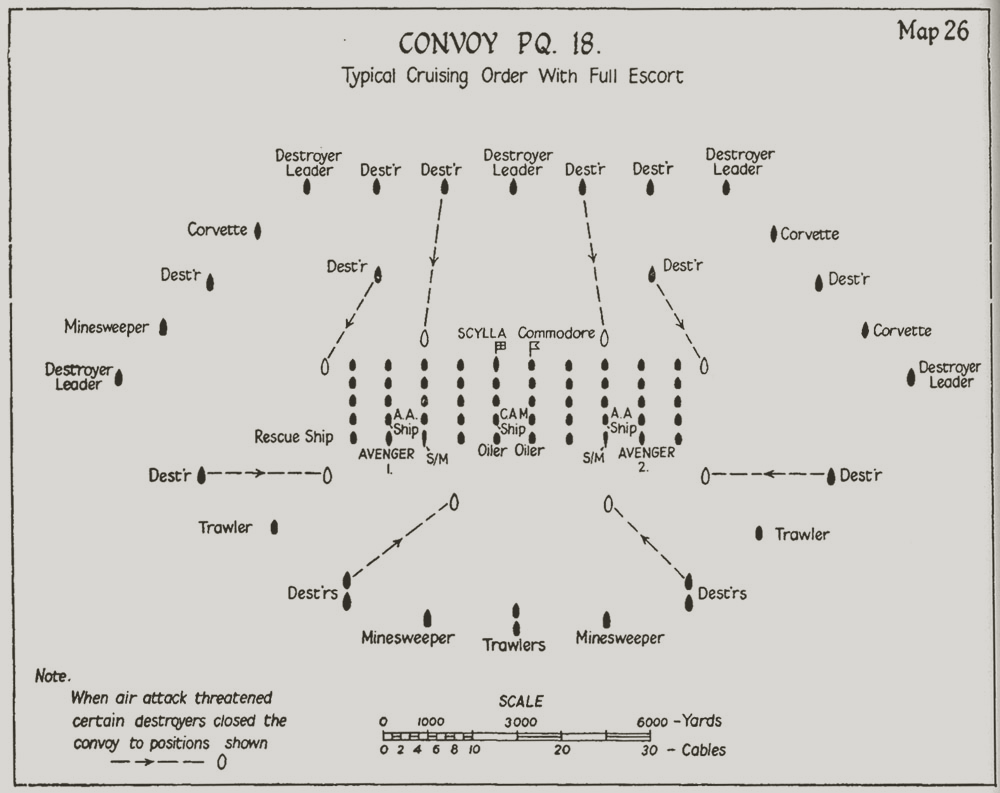
The complex structure of a WW2 convoy
The convoy is now alerted of the presence of one or multiple U-boats, even if it can’t locate the threat with any degree of precision. That’s the best case scenario, as torpedo bubble trails may have in part given up the U-boat’s location. Regardless of how compromised the attacker is, the element of surprise is now lost, and the convoy scrambles into action. Escorts, if present, will converge toward the area of the attack (a convoy can be several kilometers long). Defenseless ships will start taking evasion maneuvers, like zigzagging, making additional attacks more difficult. In any case, part of the escort will remain behind to protect crippled ships, or to harass the U-boat if they have a general idea of its location.
The best bet for the U-boat is to sail away, and regain the concealment advantage while the crew reloads the tubes (which could take 10 minutes per tube on average on a Type VII). If all goes well, the engagement resets to phase 1; go for another attack.

Escort ships at work
Phase 3 is a lot more chaotic and fast paced. The captain must make a series of quick decisions. Fast analysis and adaptation is required. It may be tempting to immediately dive to relative safety from depth charges, but this option blinds the U-boat, making more difficult to react to a rapidly evolving situation. Submerged U-boats see their speed cut in half under the limited propulsion of the electric motors, sometimes compromising a quick escape.
There’s been logs describing captains firing a spread of torpedos at an escort ship, hoping to get rid of the threat while they still had the advantage of invisibility. If the escort is absent or incapacitated, a new set of dilemmas arise; better to stay and deliver the coup de grâce to a crippled ship, or engage a pursuit of the remainder of the convoy? And if ships have split, which one makes the best target? If the U-boat has sustained damage, better to postpone the repairs and chase, or play it safe?
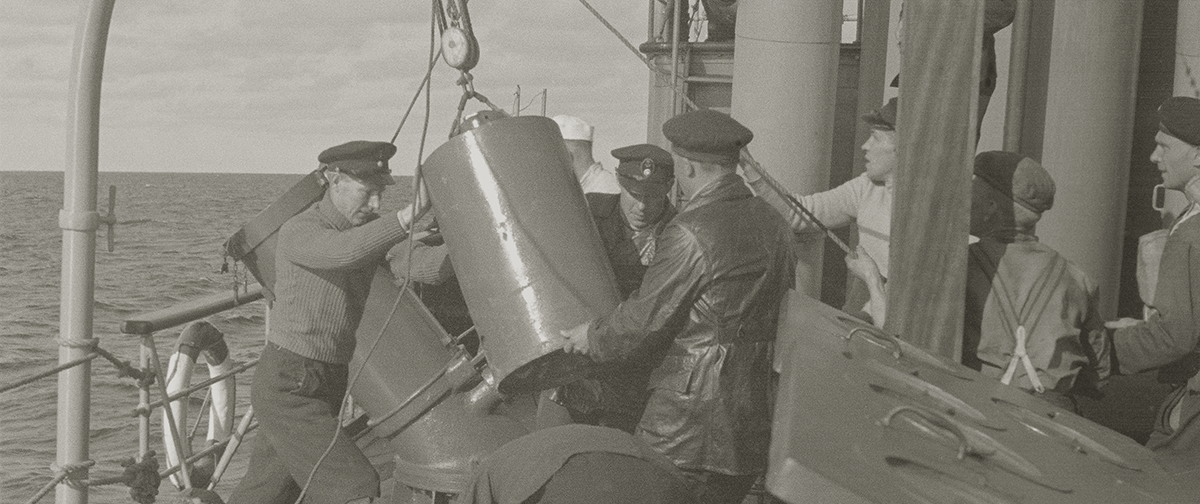
Sailors load depth charges
These are just a fraction of a plethora of high stakes problems captains had to solve during these engagements. Add to this changing factors such as time of day, visibility, sea conditions, crew experience, type of submarine, and the gameplay possibilities become obvious.
However this only makes sense if the player has access to enough data. That’s why I put so much effort in representing time, wind, and cloud coverage in exterior views. But they’re just part of the essential feedback required to make informed tactical choices, in particular as it relates to targets; their class, range, speed, heading, angle on bow, and behavior. This information is in part hinted at in the exterior views, and in part inaccessible. That explains the need for the other two screens that will constitute the meat of the engagement gameplay loop. So what are they? Let’s start with the tactical chart.
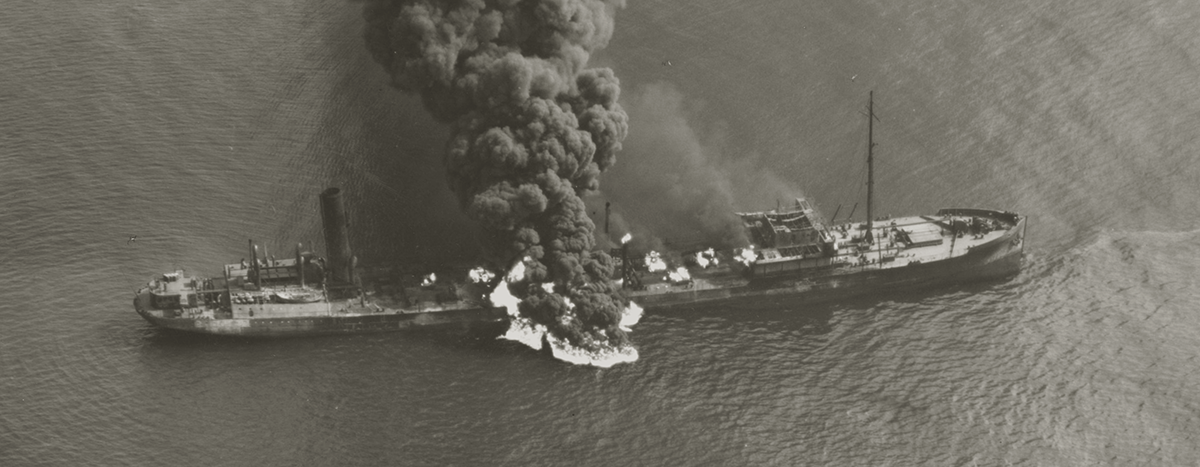
The tanker Byron D. Benson torpedoed while traveling off the coast of North Carolina in April 1942.
When to Indulge
Saying that I questioned the tactical chart view is an understatement. There hasn’t been a week that I didn’t think about it since I began working on the game some 8 months ago. And I must have flipped on the question at least a dozen times.
The topic is central to the identity of the game, which in part explains my anxiety. In my mind a tactical map implies more moment to moment complexity. And the problem becomes: “How much complexity can the controls and gameplay afford before the game feels like work?”, or “How slow and granular can the game be before it has no business being on Playdate?” I was also concerned with how feasible is a map on the small Playdate screen.

The captain plots a course in Das Boot (Wolfgang Petersen)
It’s possible that wargame and simulation fans would rather see the game a bit too finicky than not enough. As part of this crowd, I have high tolerance for slow and complex games, but somehow I also love portable consoles, which is an odd combination. Even so, the physical reality can’t be ignored. The Playdate’s screen size and lack of backlighting makes long gameplay sessions uncomfortable. The 2 buttons severely limit the user interface. And the battery life forbids prolonged unplugged play.
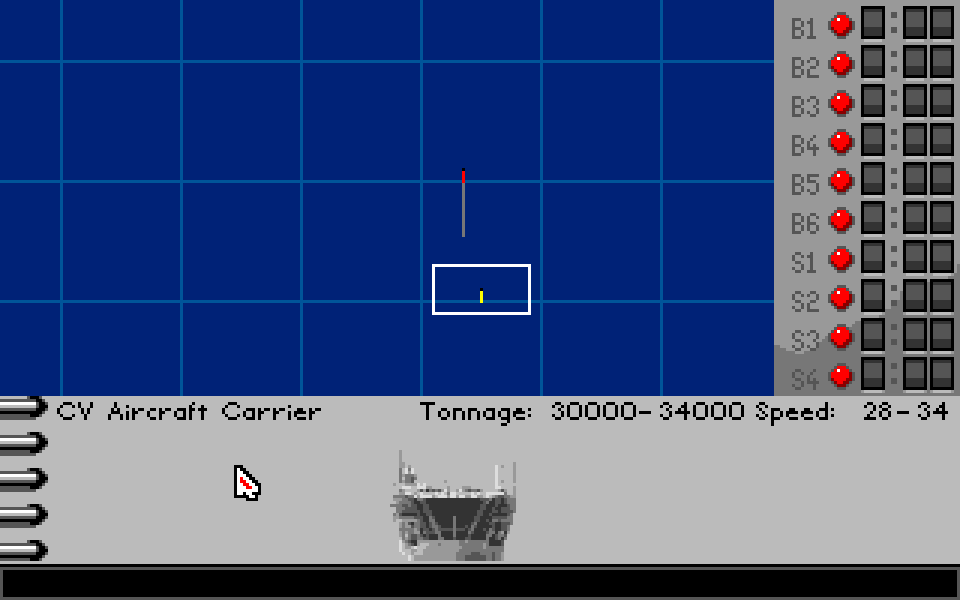
Even Silent Service had a tactical chart
I already mentioned that Atlantic ’41 is less a technical simulation than a wargame and resource management game. I don’t want the player to deal with the detailed operation of the U-boat. That’s what the crew is for. The gameplay should revolve around high level tactical decisions, (when to dive, what ship to target, when to disengage, when to repair, how to train the crew, whom to promote etc…), and leave the technicalities in the backdrop.
For the longest time I tried to come up with a system that wouldn’t give direct control of the U-boat to the player. Instead of setting speed and heading, you would instruct the 1st officer to maneuver the boat into a position to target a given ship. This would, in theory, eliminate the need of many controls, lighten the UI, and make for a much faster paced gameplay.
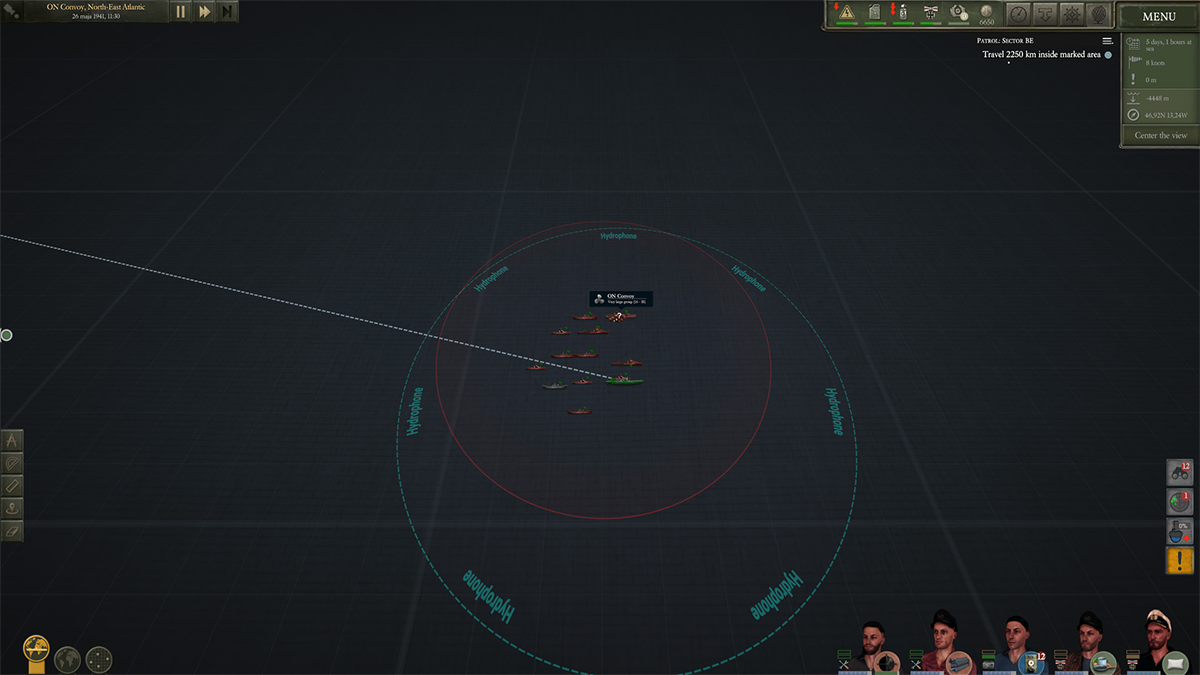
UBOAT (Deep Water Studio) - Tactical chart and real time top view all rolled into one
But I didn’t like any of the systems I came up with. They turned Atlantic '41 into something that I wasn't excited to play. And with that the realization: don’t overthink; just make the game you want. Because none of these self imposed constraints made the design more fun or creative. I was battling my own instincts, trying to conjure a game to please more people, but it stifled the game with abstract mechanics.

The elegant Sparrow Solitaire is a remarkable example of how much information the Playdate screen can display
The intent wasn’t wrong. Making a game that plays well on the targeted platform is a legitimate goal. Imposed restrictions prevent self indulgence and can fuel creativity. But you can’t go against the project’s nature, even knowing that the gameplay will deter a number of people. So I went back and looked at the game with my good old simple rule in mind: “Make it like you would want to play it”. Sounds obvious, and it is. And yet how easy it is to forget.

Silent Hunter makes the choice of a physical map
It then became evident that the player needed to be in direct control of the U-boat; to live these typical engagement phases from the logs, where each turn is like moving pieces on a chess board. And this, no matter how you look at it, requires a board, an immediate glance at the tactical situation; in other words, a chart. In fact, this idea of the captain planning his moves on a map are at the core of the fantasy of naval warfare, and Atlantic ‘41 must indulge.
One Chart to Rule Them All
With that settled, I began to mock something up in Photoshop, focusing on functionality, but not forgetting the art either. I find that look and function intertwine, one informing the other, or imposing constraints. I’ve been bit in the past trying to slap an art style onto a rigid design, and it’s not fun. Neither is redoing large chunks of art because it collides with the design.
From a gameplay standpoint, the chart must fulfill three basic requirements:
1. Show the player a tactical view of the current situation with identification, position and heading of all vessels, including the U-boat.
2. Help the player to visually assess the risk of being detected.
3. Give the player a projection of the tactical situation at the beginning of next turn.
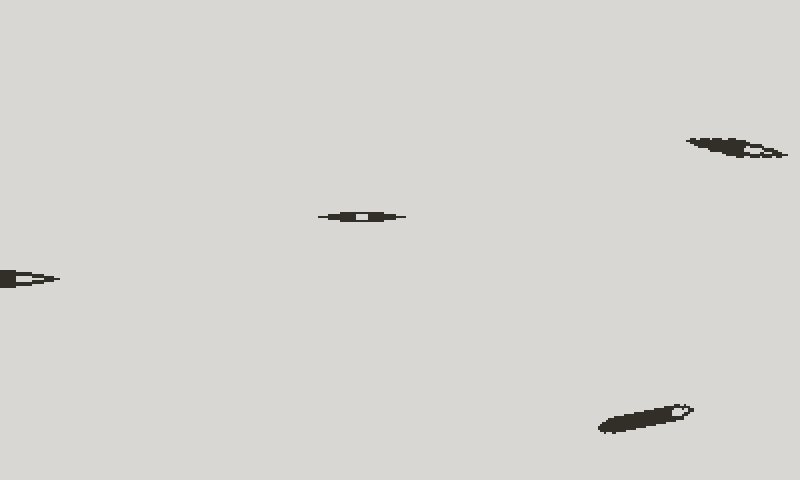
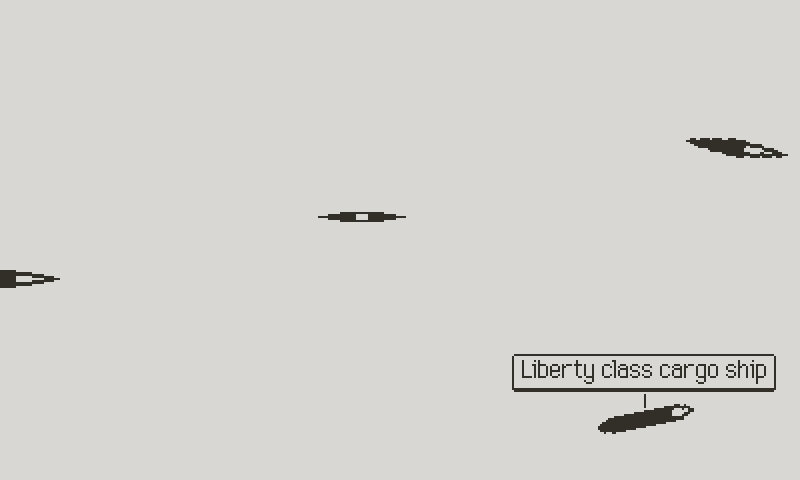
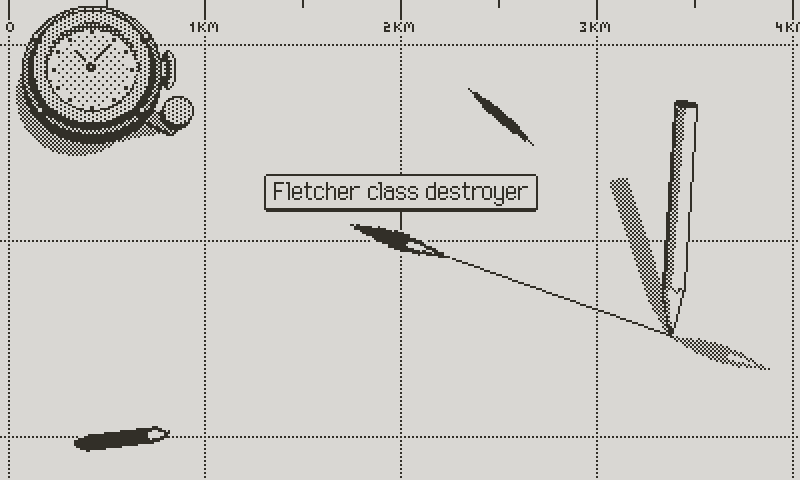
The most basic tactical view
I drew the map in its basic form, addressing the first requirement; show the position and heading of every ship within visual range of the U-boat. At the moment all merchant ships are represented with the same token, while war ships share another. At this size, I doubt that anyone will be able to remember a specific token per class. The important is to separate the threats from the defenseless targets. The U-boat has its own token, with a variant for submerged state. In fact, this iconography was inspired by an old WW2 instructional film.
The controller allows to pan the map. However, to alleviate the need of constantly moving around, I plan three levels of magnification: 10 m/pixel, 20 m/pixel, and 60 m/pixel. This basic state of the map already gives ample information, from ships position to heading. However you need a way to tell the ships apart.
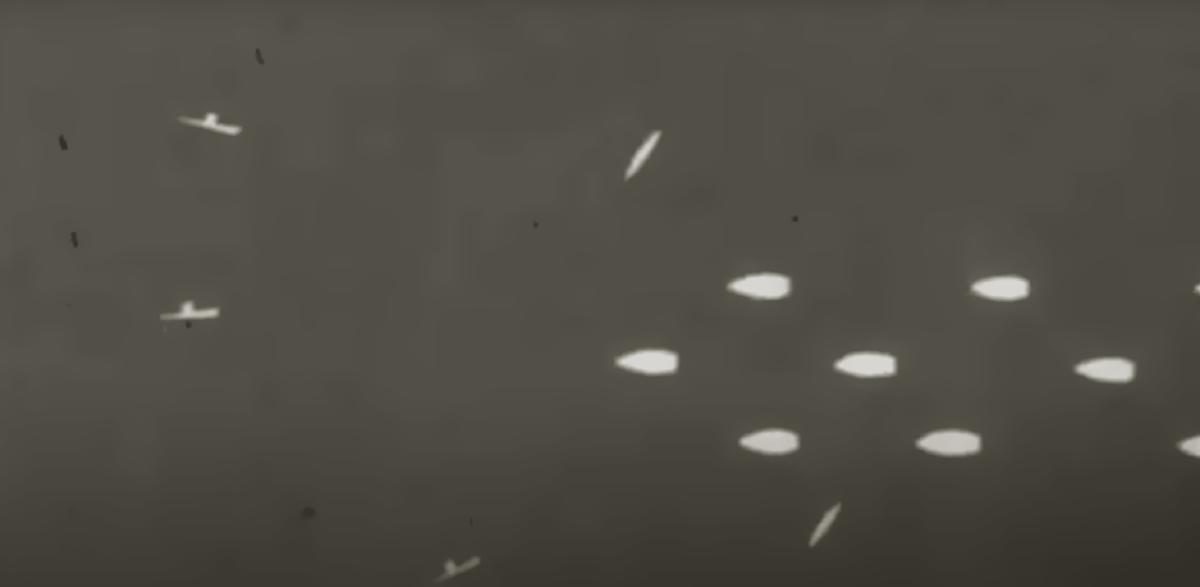
A WW2 instructional film
To access additional information, center a ship on the map, and then press A to cycle through three overlay toggles. A simple ID tag is the first overlay. It pins a label next to the selected ship, showing its type, class, and name if applicable. Any overlay stays active until you select another ship, which means that only one ship at a time can show additional information. It’s an unfortunate constraint to avoid clutter and performance degradation. Play test will reveal if the system is viable.
The identification tag
Now to the second requirement of the map: detection risk. The idea is to overlay dithered circular zones onto ships, corresponding to their level of awareness. Outside the lighter circle, the U-boat is beyond detection range, too far for sight or instruments. The light grey zone shows the area in which the U-boat is only detectable if surfaced. Then comes a darker grey circle, in which it’s necessary to approach with caution, moving slowly, in particular in calm seas, where the wake of the periscope is a clear giveaway.
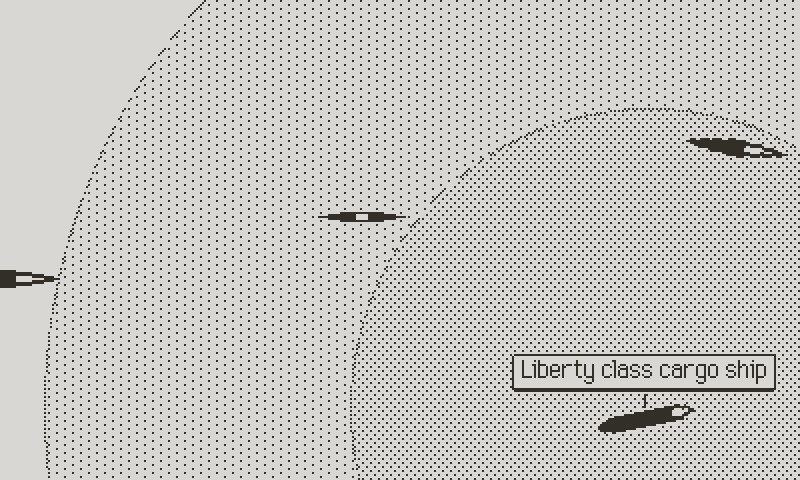
Detection zones
Finally, the darkest grey area is the most dangerous; it’s within ASDIC (or sonar) range, which requires extreme precautions. In this situation, it’s best to hide deep below thermal layers, and order silent running. Any sound from the crew, propeller cavitation, or engine noise is likely to give the U-boat away, with dire consequences.
Of course, these zones are merely an indication, not to be treated as 100% predictable and constant throughout. For instance, even surfaced, you won’t be immediately detected as soon as you cross the threshold of the light grey zone. But risk increases as you move further in. Other factors modify these odds; the light grey zone is safer at twilight from the right side of the sun. At night, visibility varies with the moon phases. So the zones give a reference point to the player, but avoiding detection still requires experience and thinking, as additional factors affect the math.

The dark circle shows the ASDIC range
The third and final information overlay is simpler; it’s the projected trajectory and position of the ship at the beginning of the next turn. In many cases, it’s less important to know where a ship is than where it’s going to be, as it allows you to plan ahead. Something important: every turn, events could affect the behavior of any or all ships. For instance, a crippled ship won’t cover the distance it was supposed to. A target that spots the U-boat will likely alter its course and sail away from the threat. The crew may even radio everybody in the convoy, triggering a cascade of events.
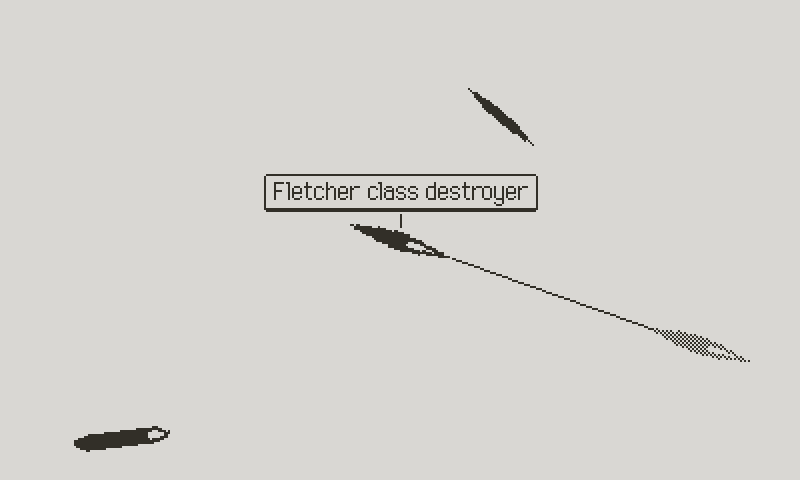
Projected course
In rare circumstances, the convoy may receive orders to change course, for reasons others than the ones mentioned above. This means that, like the detection zones, the projected course isn’t 100% reliable. But it’s another tool to conduct your strategy.
I should also mention a few differences regarding the lowest magnification factor. In this mode, ships are shown as small markers, which don’t show their heading. It’s probable that information overlay will be absent, because at 60 m/pixel the resolution is too low to be of any practical use. The goal of this scale is to show all ships in one screen, as to give the player an immediate global overview of the engagement.
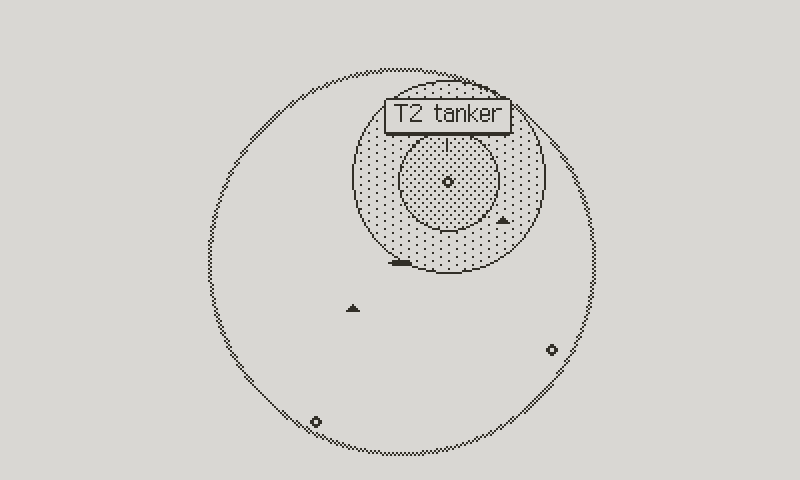
Global vision of the engagement
The Analog World (Part One)
As mentioned in the beginning of the log, it’s best to balance the needs of the art and the design early on. If you’re lucky, they naturally align, which was not the case here. Two conflicting notions made the art direction tricky to untangle.
It’s obvious that at a resolution of 400 x 240, every pixel is prime real estate. In particular when dealing with graphics and user interface. As a utilitarian screen, the chart must be legible, which implies economy. And therein lies the conflict: a boring chart is the most effective.
Finding and angle, or a theme, helps me to solve many stylistic problems. If I can think of a lens through which to process the art, then ideas naturally emerge. I watched Das Boot for the 50th time (the long format tv show, not the abridged film), and it occurred to me that the mid 20th Century was all analog.

A stopwatch from Das Boot (Wolfgang Petersen)
A WW2 submarine was a giant network of electrical cables, valves, mechanical switches, gears and hydraulic gauges. And since navigation was done with paper, rulers, compasses, and pencils, it makes sense for the UI of Atlantic ‘41 to reflect this analog nature. Instead of treating the chart as a digital display, it should be a physical map. Ships should look simple enough that they could have been drawn in, and their courses traced with a ruler and a pencil.
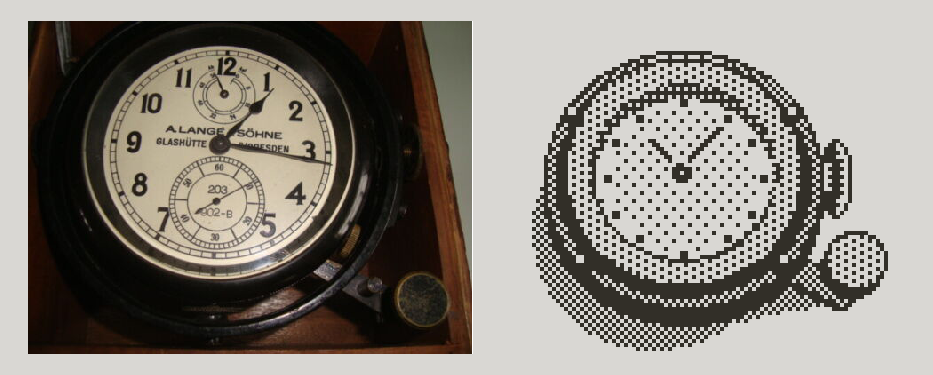
I began to search reference for nautical charts. One thing they all have in common is a scale reference system, like a grid. Adding this to a blank screen already gives it a blueprint look, and informs at the same time. Time is an essential data in navigation, and I found a picture of a beautiful WW2 watch. I simplified the design for readability, trying to retain its vintage character, and placed it in the top corner.
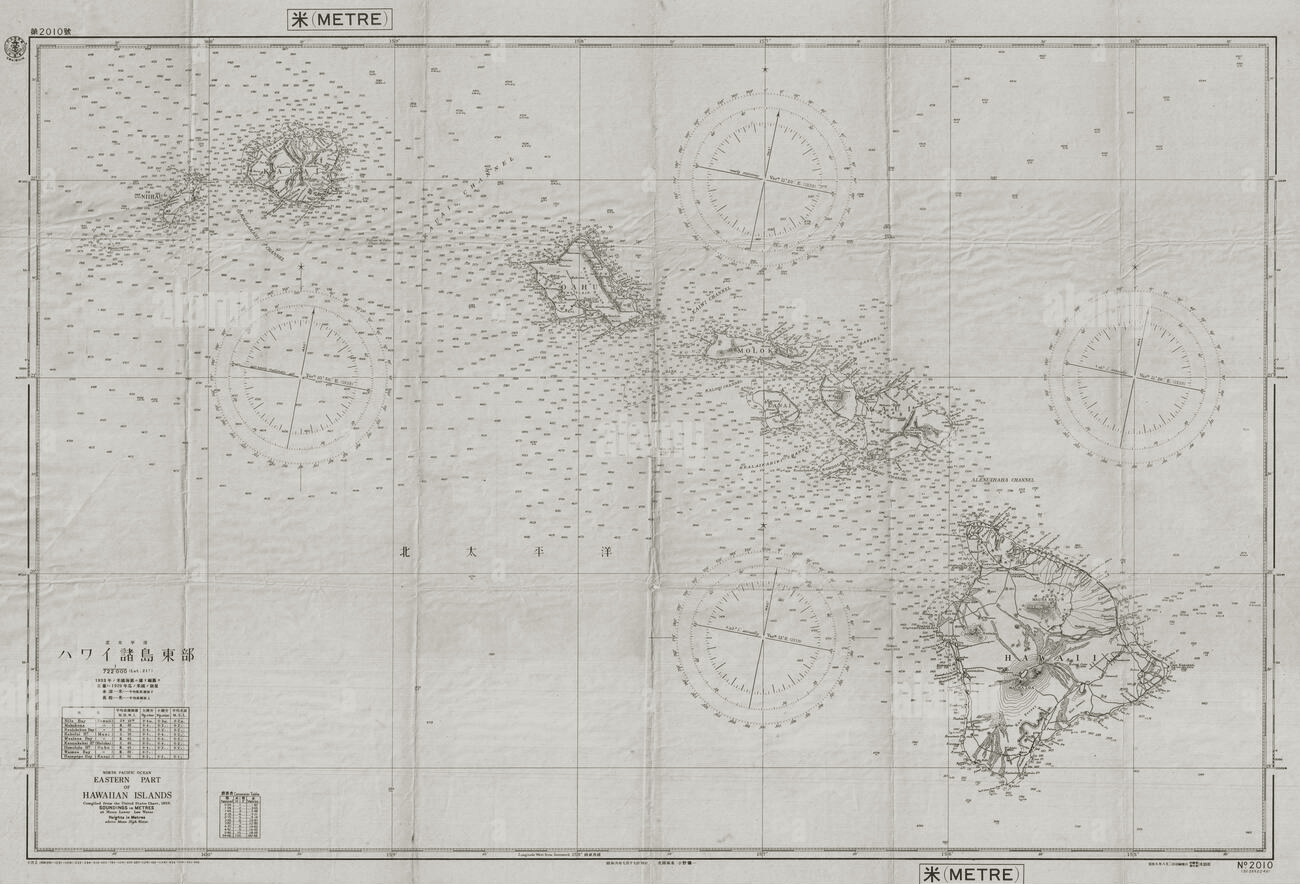
A Japanese nautical chart
Not much more to add onto the map itself. But with detection areas and identification labels, it was already looking better; sparse but not empty, and above all readable. Yet something was missing. It’s a scene from the great “Saving Private Ryan” that gave me the idea; Captain Miller recruits corporal Upham as his new French interpreter. When Upham asks if he can bring his typewriter, Miller shows him the pencil he’s holding. Scrubbing through Das Boot revealed good reference shots of pencil and compasses.
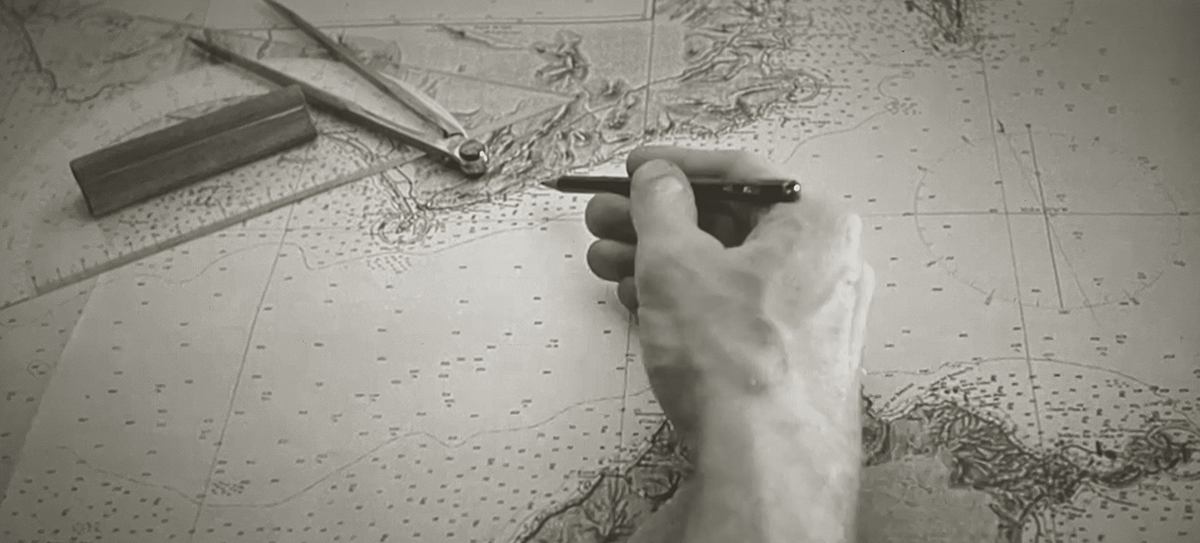
Pencil and compass in Das Boot (Wolfgang Petersen)
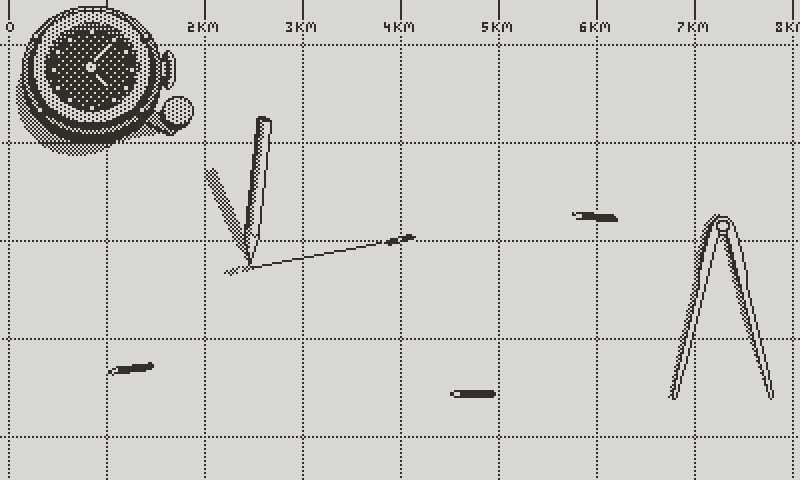
I drew the pencil resting on the chart. It will disappear when panning the map, as if held in hand while the paper slides around. And since there’s a pencil, why not using it to draw the projected course on screen? This should be a fun and satisfying thing to watch. For variety, I replaced the pencil by a compass for the 20m/pixel scale, since both tools are iconic.
From reference to 1-bit
The large scale map (60m / pixel) was the most fun to do. Because it’s a fixed map, I had better opportunities to dress it up. First thing was to show the chart as a large piece of rolled up paper. It’s wide enough to go well beyond the maximal sight range (6 km), which left free space for accessories, like rulers and a notebook.

Map with watch and scale reference (10 m/pixel)
Pencil tracing a course
I may keep the detection areas available at this scale, but I’m not sure if it’s practical. The main goal is to show the location of all forces in the engagement. The identification labels may still be of use though. In any case, these mock-ups are still theoretical at this point. No doubt that things will change to conform to the realities imposed by performance and user experience.
The black watch face signals night time (20 m/pixel)
This was the longest log I ever wrote, which is expected as we get into the more complex aspects of the project. I have a lot of work ahead of me, but this is an exciting time for the project, as the first glimpses of real gameplay come into view. I already have a good portion of the Torpedo Data Computer mock-ups done, which will be the subject of the next devlog. I will also report about the progress on the chart screen implementation.
More soon.
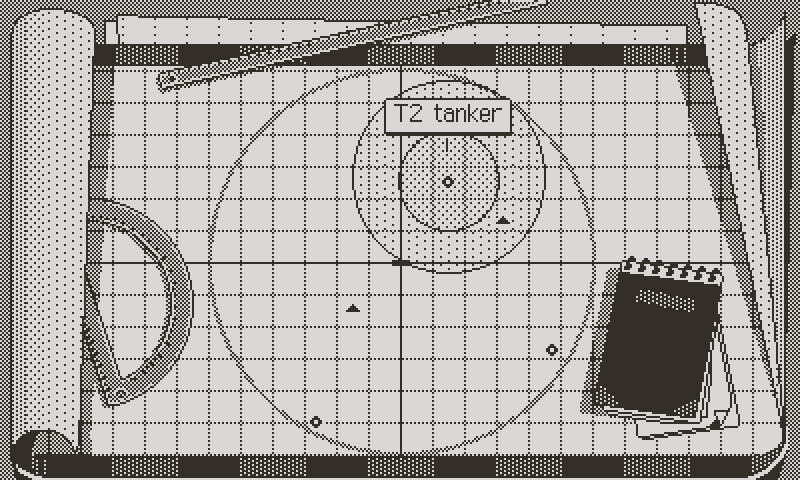
Final 60 m/pixel map
Comments
Log in with itch.io to leave a comment.
Great read. I love how a very methodical, deconstruction, research based approach one one hand, and intuition and creativity on the other, come together in this project, and how vividly you describe that process. So much fun already, without even having the game.
It’s always been my goal to try and share as much as I can about the process and in an entertaining way if possible, so it’s rewarding to hear that you enjoy the logs ;) Thank you for taking the time to encourage me.
This all looks bloody amazing, congrats! I played a lot of 688 Attack Sub on the Amiga as a kid, so I'm hyped for this.
Thank you! I have many great memories of the Amiga as well, playing some Microprose classics.
Wow, how good do these look!? Amazing work.
Thank you, good sir.
Really cool how you kept the charts simple while staying true to the theme by adding the protractor, pencil and watch.
And I spent a good while staring at that first gif because watching the sun rays on the water never gets old.
Very glad you like the chart! There might be some shifting as it goes into the game, but hopefully not too much :)